Hi quest ,  welcome  |  sign in  |  registered now  |  need help ?
Showing posts with label HOW TO TRADE FOREX. Show all posts

Weekly Outlook For Forex Trading Feb. 24-28

Written By Savoeun on Saturday, 22 February 2014 | 00:03

Weaker than expected data was reported almost everywhere. After suffering losses, can the US dollar emerge as a winner? Euro-zone inflation, Us consumer confidence, Housing data, Unemployment Claims and GDP data from the US, UK and Canada are among the major events on our calendar. Here is an outlook on the main market-movers this week.

The weakness was seen everywhere: a terrible Philly Fed Index in the US, a disappointing growth rate in Japan, a weak PMI in China, lower business sentiment in Germany and a rising unemployment rate in the UK, among others. Nevertheless, it seems that one central bank is not deterred: the Federal Reserve. Meeting minutes from the last decision showed again that the taper train is on the track. So, after a streak of losses, can the US dollar make a comeback? Let’s start:
1.      German Ifo Business Climate: Monday, 9:00. German business confidence soared to 110.6 in January from 109.5 in December, rising to the highest level since July 2011. The reading surpassed forecasts of 110.2, indicating German economy is expanding full steam. The Bundesbank has projected a strong expansion in 2014, after the weak final quarter of 2013 where German economy shifted from domestic demand to global trade. Another climb to 110.7 is expected this time.
2.      US CB Consumer Confidence: Tuesday, 15:00. Consumers sentiment unexpectedly edged up in January to 80.7 from 77.5 in December, reaching a five-month high amid renewed optimism about the economy and labor market. Economists expected a weaker reading of 78.3. US jobs market improved offering plentiful positions and higher wages propelling consumer purchases and confidence. A small decline to 80.2 is forecasted.
3.      UK Second Estimate GDP: Wednesday, 9:30. The first release of UK GDP showed a growth rate of 0.7% in Q4 2013, which is quite solid growth. A confirmation of this figure is expected in the second release. According to NIESR monthly estimates, GDP has increased by 0.8% in the three months ending in January 2014. The Bank of England is expected to keep interest rates on hold until the second quarter of 2015 and annual GDP growth will reach 2.5% in 2014 and 2.1% in 2015. 
4.      US New Home Sales: Wednesday, 15:00. The annual number of new home sales disappointed for the second consecutive month with a seasonally adjusted annual rate of 414,000 units, much weaker than the 445,000-unit pace registered in November missing predictions for a rise to 457,000. Many blamed the harsh winter conditions for the ongoing fall in the housing sector with a 36.4% fall in the Northeast which was hit by cold temperatures. This fall is not consistent with the strong demand reflected in the declining inventory for new and existing homes, indicating this is only a temporary setback. Another drop to 406,000 is expected now.
5.      US Durable Goods Orders: Thursday, 13:30.  Orders for long-lasting U.S. manufactured goods excluding transportation items plunged unexpectedly in December by 1.6% after a 1.2% gain in the previous month posting the biggest decline since March 2013. Most orders were weak, with the exception for machinery, and electrical equipment, appliances and components rising. Durable goods orders fell 4.3% in December after a 3.4% climb in November, pulled down by weak demand for transportation equipment, primary metals, computers and electronic products and capital goods.  Durable Goods Orders are expected to decline 0.7% while core Durable Goods Orders  are expected to fall 0.1%.
6.      US Unemployment Claims: Thursday, 13:30. The number Americans filing applications for unemployment benefits dropped by 3,000 last week, to a seasonally adjusted 336,000, indicating firing has not increased. The number of applicants became stable in recent weeks despite modest levels of hiring in January and February, signaling business confidence is improving. In recent months, frigid weather slowed down hiring, retail sales and home construction. Job growth for the past two months reached only a half the monthly average for the previous two years. However lower unemployment rate of 6.6% was an improvement from December. Another drop to 333,000 is anticipated now.
7.      Euro-zone Flash CPI: Friday, 10:00. As the focus of the ECB shifted to inflation (or the lack of it), the importance of CPI has risen. The surprising drop in inflation in October triggered a rate cut in November. Year over year CPI is expected to remain unchanged at 0.7%. However, a strong euro and a fragile recovery could result in a new low for CPI and perhaps for core CPI, which also bottomed out at 0.7% so far. A drop to new cycle lows could trigger a negative deposit rate from the ECB in March.
8.      Canadian GDP: Friday, 13:30. The Canadian economy expanded by 0.2% in November, in line with market forecast, rising for the fifth straight month amid a recovery in the oil industry outpaced a decline in manufacturing. This increase was preceded by a 0.3% increase in both September and October. Oil and gas extraction rose 2.6%, after a 0.7% decline in October, and mining and quarrying increased by 1.3%. Overall manufacturing output climbed 0.4% while the service sector increased by 0.2%. Canadian economy is expected to contract 0.2% this time.
9.      US GDP: Friday, 13:30. According to the first release, the US economy grew by 3.2% in Q4 2013. Already at that release, there were worries about the quality of this growth, with an inventory buildup taking a large part in that growth. After a few weak figures, expectations are for a downgrade of growth to 2.6% at the second and not final release.
10.  US Pending Home Sales: Friday, 15:00. The number of contracts to purchase previously owned homes in the U.S. plunged in December by 8.7% following a 0.3% decline in the preceding month. This was the worst reading since May 2010 amid higher borrowing costs and bad weather conditions halting sales. Analysts expected a modest drop of 0.3%, but unusually cold weather discouraged potential buyers. A rise of 2.9% is forecasted.
11.  Mark Carney speaks: Friday, 15:30. BOE Governor Mark Carney will speak in Frankfurt on Central Bankers. Earlier this month Carney said there is a need to change the compensation structures so that banks could see whether employees had taken undue risks or behaved badly and that compensation of bankers should be withheld and deferred for a very long time. These comments were made after news that Barclays was paying bigger bonuses despite announcing plans to cut staff in response to a fall in profits. Carney may also refer to the developments in the housing market and the means to prevent a bubble from developing. Any comment on the interest rate will be closely scrutinized after Carney hinted a hike in Q2 2015.
That’s it for the major events this week. Stay tuned for coverage on specific currencies
*All times are GMT.


00:03 | 0 comments

EUR/USD Outlook for the near term future 2014

Written By Savoeun on Tuesday, 18 February 2014 | 17:44


"EUR/USD seemed to satisfy the consensus early in the new year, settling into a low intensity decay from 1.38 to sub-1.35 in Jan. However, price action in Feb has seen those losses completely unwound. There are four key near term (inter-related) themes for EUR/USD: 1) the complexion of the US data; 2) the complexion of the Eurozone data; 3) the prospects for ECB easing; and 4) developments in the periphery. We assess that on balance the positives outweigh the negatives. We quantify these forces with a simple fair value model and find EUR/USD equilibrium has jumped 1.2% in the last 2 weeks, the biggest 2 week rise in more than 6 months."

"We are predisposed to selling EUR/USD on strength since medium term headwinds holding back the US (fiscal policy and private sector deleveraging) seem less potent than in the Eurozone. However, in the short term the aforementioned factors seem more likely to evolve in favour of yet higher EUR levels. We could see a run at the late 2013 1.3895 highs before all is said and done. 1.40 may not be an impossible target. However, at these levels we would consider EUR/USD overdone and would establish shorts."
17:44 | 0 comments

4 Types Of Indicators FX Traders Must Know

Written By Savoeun on Monday, 17 February 2014 | 00:23

By Jay Kaeppel on November 10, 2010

Many forex traders spend their time looking for that perfect moment to enter the markets or a telltale sign that screams "buy" or "sell". And while the search can be fascinating, the result is always the same. The truth is, there is no one way to trade the forex markets. As a result, successful traders must learn that there are a variety of indicators that can help to determine the best time to buy or sell a forex cross rate

Here are four different market indicators that most successful forex traders rely upon.

Indicator No.1: A Trend-Following Tool
It is possible to make money using a countertrend approach to trading. However, for most traders the easier approach is to recognize the direction of the major trend and attempt to profit by trading in the trend's direction. This is where trend-following tools come into play. Many people misunderstand the purpose of trend-following tools and try to use them as separate trading systems. While this is possible, the real purpose of a trend-following tool is to suggest whether you should be looking to enter a long position or a short position. So let's consider one of the simplest trend-following methods – the moving average crossover.

A simple moving average represents the average closing price over the number of days in question. To elaborate, let's look at two simple examples – one longer term, one shorter term. (For related information on moving averages, see Exploring The Exponentially Weighted Moving Average.)

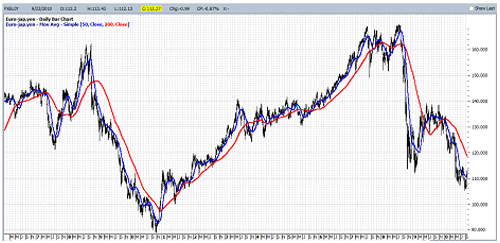
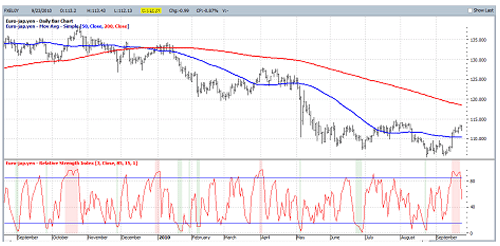
Figure 1 displays the 50-day/200-day moving average crossover for the euro/yen cross. The theory here is that the trend is favorable when the 50-day moving average is above the 200-day average and unfavorable when the 50-day is below the 200-day. As the chart shows, this combination does a good job of identifying the major trend of the market - at least most of the time. However, no matter what moving average combination you choose to use, there will be whipsaws

Figure 1: The euro/yen with 50-day and 200-day moving averages
Source: ProfitSource


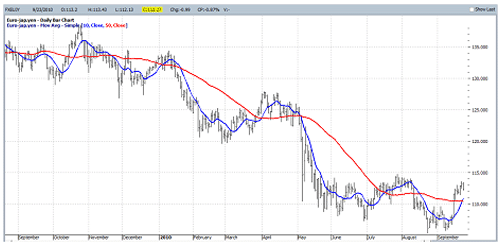
Figure 2 shows a different combination – the 10-day/30-day crossover. The advantage of this combination is that it will react more quickly to changes in price trends than the previous pair. The disadvantage is that it will also be more susceptible to whipsaws than the longer term 50-day/200-day crossover. 

Figure 2: The euro/yen with 10-day and 30-day moving averages
Source: ProfitSource


Many investors will proclaim a particular combination to be the best, but the reality is, there is no "best" moving average combination. In the end, forex traders will benefit most by deciding what combination (or combinations) fits best with their time frames. From there, the trend - as shown by these indicators - should be used to tell traders if they should trade long or trade short; it should not be relied on to time entries and exits. (For additional information, check out Forex: Should You Be Trading Trend Or Range?)

Indicator No.2: A Trend-Confirmation Tool
Now we have a trend-following tool to tell us whether the major trend of a given currency pair is up or down. But how reliable is that indicator? As mentioned earlier, trend-following tools are prone to being whipsawed. So it would be nice to have a way to gauge whether the current trend-following indicator is correct or not. For this, we will employ a trend-confirmation tool. Much like a trend-following tool, a trend-confirmation tool may or may not be intended to generate specific buy and sell signals. Instead, we are looking to see if the trend-following tool and the trend-confirmation tool agree. 

In essence, if both the trend-following tool and the trend-confirmation tool are bullish, then a trader can more confidently consider taking a long trade in the currency pair in question. Likewise, if both are bearish, then the trader can focus on finding an opportunity to sell short the pair in question. 

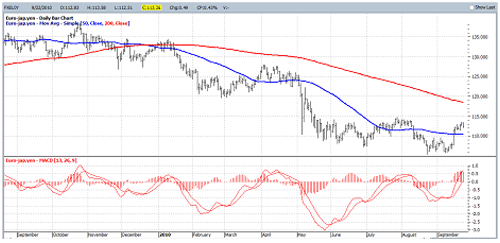
One of the most popular – and useful – trend confirmation tools is known as the moving average convergence divergence (MACD). This indicator first measures the difference between two exponentially smoothed moving averages. This difference is then smoothed and compared to a moving average of its own. When the current smoothed average is above its own moving average, then the histogram at the bottom of Figure 3 is positive and an uptrend is confirmed. On the flip side, when the current smoothed average is below its moving average, then the histogram at the bottom of Figure 3 is negative and a downtrend is confirmed. (Learn more about the MACD in A Primer On The MACD.

Figure 3: Euro/yen cross with 50-day and 200-day moving averages and MACD indicator
Source: ProfitSource


In essence, when the trend-following moving average combination is bearish (short-term average below long-term average) and the MACD histogram is negative, then we have a confirmed downtrend. When both are positive, then we have a confirmed uptrend.

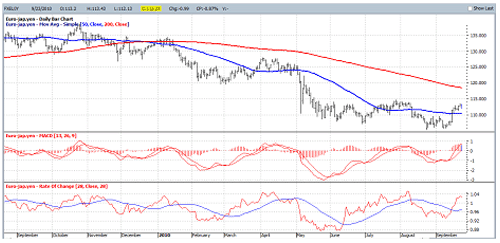
At the bottom of Figure 4 we see another trend-confirmation tool that might be considered in addition to (or in place of) MACD. It is the rate of change indicator (ROC). As displayed in Figure 4, the red line measures today's closing price divided by the closing price 28 trading days ago. Readings above 1.00 indicate that the price is higher today than it was 28 days ago and vice versa. The blue line represents a 28-day moving average of the daily ROC readings. Here, if the red line is above the blue line, then the ROC is confirming an uptrend. If the red line is below the blue line, then we have a confirmed downtrend. (For more on the ROC indicator, refer to Measure Momentum Change With ROC.)

Note in Figure 4 that the sharp price declines experienced by the euro/yen cross from mid-January to mid-February, late April through May and during the second half of August were each accompanied by:

  • The 50-day moving average below the 200-day moving average

  • A negative MACD histogram 

A bearish configuration for the ROC indicator (red line below blue) 

Figure 4: Euro/yen cross with MACD and rate-of-change trend confirmation indicators
Source: ProfitSource.com


Indicator No.3: An Overbought/Oversold Tool
While traders are typically well advised to trade in the direction of the major trend, one must still decide whether he or she is more comfortable jumping in as soon as a clear trend is established or after a pullback occurs. In other words, if the trend is determined to be bullish, the choice becomes whether to buy into strength or buy into weakness. If you decide to get in as quickly as possible, you can consider entering a trade as soon as an uptrend or downtrend is confirmed. On the other hand, you could wait for a pullback within the larger overall primary trend in the hope that this offers a lower risk opportunity. For this, a trader will rely on an overbought/oversold indicator. 

There are many indicators that can fit this bill. However, one that is useful from a trading standpoint is the three-day relative strength index, or three-day RSI for short. This indicator calculates the cumulative sum of up days and down days over the window period and calculates a value that can range from zero to 100. If all of the price action is to the upside, the indicator will approach 100; if all of the price action is to the downside, then the indicator will approach zero. A reading of 50 is considered neutral. (More on the RSI can be found in Relative Strength Index Helps Make The Right Decisions.)

Figure 5 displays the three-day RSI for the euro/yen cross. Generally speaking, a trader looking to enter on pullbacks would consider going long if the 50-day moving average is above the 200-day and the three-day RSI drops below a certain trigger level, such as 20, which would indicate an oversold position. Conversely, the trader might consider entering a short position if the 50-day is below the 200-day and the three-day RSI rises above a certain level, such as 80, which would indicate an overbought position. Different traders may prefer using different trigger levels.

Figure 5: Euro/yen cross with three-day RSI overbought/oversold indicator
Source: ProfitSource


Indicator No.4: A Profit-Taking Tool
The last type of indicator that a forex trader needs is something to help determine when to take a profit on a winning trade. Here too, there are many choices available. In fact, the three-day RSI can also fit into this category. In other words, a trader holding a long position might consider taking some profits if the three-day RSI rises to a high level of 80 or more. Conversely, a trader holding a short position might consider taking some profit if the three-day RSI declines to a low level, such as 20 or less. 

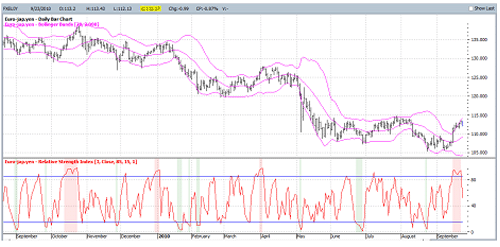
Another useful profit-taking tool is a popular indicator known as Bollinger Bands®. This tool adds and subtracts the standard deviation of price data changes over a period from the average closing price over that same time frame to create trading "bands". While many traders attempt to use Bollinger Bands® to time the entry of trades, they may be even more useful as a profit-taking tool. 

Figure 6 displays the euro/yen cross with 20-day Bollinger Bands® overlaying the daily price data. A trader holding a long position might consider taking some profits if the price reaches the upper band, and a trader holding a short position might consider taking some profits if the price reaches the lower band. (Refer to The Basics Of Bollinger Bands® for more information on this tool.)

Figure 6: Euro/Yen cross with Bollinger Bands®
Source: ProfitSource


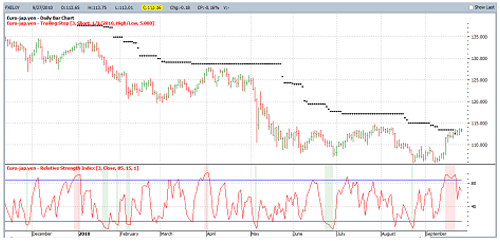
A final profit-taking tool would be a "trailing stop." Trailing stops are typically used as a method to give a trade the potential to let profits run, while also attempting to avoid losing any accumulated profit. There are many ways to arrive at a trailing stop. Figure 7 illustrates just one of these ways. 

The trade shown in Figure 7 assumes that a short trade was entered in the forex market for the euro/yen on January 1, 2010. Each day the average true range over the past three trading days is multiplied by five and used to calculate a trailing stop price that can only move sideways or lower (for a short trade, or sideways or higher for a long trade).

Figure 7: Euro/yen cross with a trailing stop


The Bottom Line
If you are hesitant to get into the forex market and are waiting for an obvious entry point, you may find yourself sitting on the sidelines for a long while. By learning a variety of forex indicators, you can determine suitable strategies for choosing profitable times to back a given currency pair. Also, continued monitoring of these indicators will give strong signals that can point you toward a buy or sell signal. As with any investment, strong analysis will minimize potential risks.
00:23 | 0 comments

How to Digest Market Data and Use for Trading Forex

Written By Savoeun on Tuesday, 24 December 2013 | 00:54


One of the paradoxes in forex trading is that self-sabotage and financial destruction play such a big part in most traders’ daily lives. In fact, there are many, many traders who get their kicks from simply playing the markets, win or lose. And it is because of this that most traders do in fact lose over the long run.

It is almost as if we humans are genetically programmed to be bad traders and the end result is that many of us have perennial struggles with the markets themselves, attaching to them, in many cases, sub conscious metaphors and even giving them human characteristics.

Of course, the market is anything but human, and in order to trade forex effectively, you need to be able to understand that simple fact. 

Depersonalizing the market
Professional traders know that the market is simply a source of information and must be treated as such. It does not have any hidden agenda or ulterior motive and is not ‘out to get you’. It does not contain painful or happy information or anything like that. Indeed, any feeling that you arrive at from trading comes from how your own mental self perceives the information. Saying that the market is wrong or stupid or too high or too strong are human attributes and are clearly incorrect, because the market as a channel of information can be neither of those things. The market just ‘is’.
Professional traders know this and therefore eliminate any human attachment to the market and try to ignore all the noise that surrounds it, whether from other investors or news organizations. Only by doing so, is it truly possible to get into the real flow of the market and begin to make all the right moves.
Getting in the flow
By eliminating any attachment it becomes much easier to get into the flow of the market and any subconscious or conscious defense mechanisms that can cause you to jump into a bad trade are automatically removed.
Staying in the flow means that a trader can remain alert to an almost endless stream of possibilities and opportunities. What this means is that a trader can take advantage of numerous opportunities without suffering any of the stress, frustration or self-sabotage that comes with trading when not in the zone.
But not only can professional traders get themselves into the flow by treating the market completely objectively, they are also able to realize when they are operating out of the flow – and they will be able to do this early. Doing so means they can scale back or stop trading completely when they are just not ‘feeling it’. This is a crucial element to successful forex trading, and proves why some traders are ‘happy traders’ and others are much more stressed. Remove the attachments to the market, manage to get in the flow and you will have a much longer and rewarding trading career.

 
00:54 | 0 comments

Blog Archives

Welcome To Forex Trading

CONTACT US

Want to Open Account or Want to learn How to Trade Contact our Support Team:

Contact Numbers:

092 39 36 38
069 57 24 30
012 71 10 11 ,
096 400 4056

Email:

yinsavoeun@gmail.com
yinsavoeun@yahoo.com

chamnanom@gmail.com

Don't be hesitate to contact us, We are waiting to help you !

Warren Buffet

Warren Buffet

Bill Gates

Bill Gates

Chinese Vission

Chinese Vission